A histogram is the most frequently used diagram for displaying frequency distributions!1.) ... Understand the histogram!
|
| (Image-1) Example histogram! |
 |
| (Image-2) Example histogram output in MS Office Excel! |
 |
2.) Advantages and disadvantages of histograms!
A histogram is the most commonly used diagram to display frequency distributions!
Contents:
1.) ... Understand the histogram!
2.) ... Advantages and disadvantages of histograms!
1.) Understand the histogram!
Histogram = Histo Gram = Historical Diagram
Diagram = Chart, graphic, scheme, graphical representation!
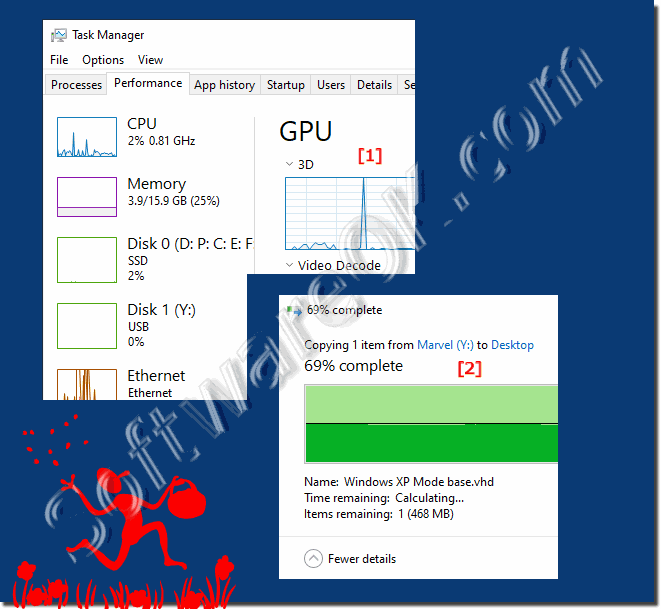
The Windows Task Manager also has a histogram, just like the copy function in Windows
( ...see Image-1 )
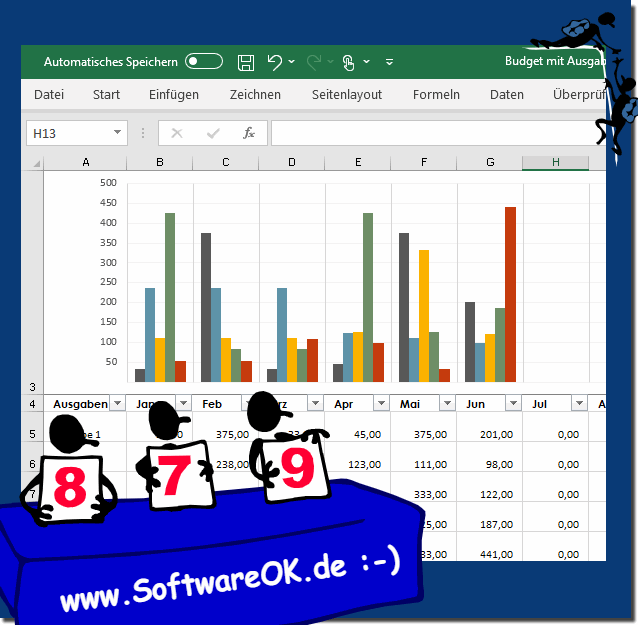
. It is often referred to as a graphical display of data with bars of different heights,
( ...see Image-2 )
if the bars are quite narrow, like in the task manager, then the histogram looks like that!
| (Image-1) Example histograms! |
 |
| (Image-2) Example histogram output in MS Office Excel! |
 |
2.) Advantages and disadvantages of histograms!
Histograms are graphical representations of data commonly used in statistics and data analysis. They have both advantages and disadvantages which are explained below:
Advantages of Histograms:
Ease of Interpretation: Histograms are easy to understand and interpret. The frequency values can be read directly from the bar heights.
Overview of large amounts of data: Histograms provide a quick overview of large amounts of data. The distribution of the data can be seen at a glance.
Comparing Data Sets: Histograms can be used to compare different data sets with each other. This allows similarities and differences between the data sets to be quickly identified.
Disadvantages of histograms:
Influence of bar width: Bar width can influence the perception of the frequency distribution. A bar width that is too wide can obscure the actual distribution.
Inadequate display of outliers: Outliers can easily be missed in histograms.
Not suitable for all data types: Histograms are not suitable for all data types. They are not suitable for categorical data.
Examples of using histograms:
In statistics: Histograms are often used in statistics to visualize data distributions.
In quality control: Histograms are used in quality control to assess the quality of products or processes.
In Business: Histograms are used in business to visualize market data or financial data.
In conclusion, histograms are useful tools for visualizing and analyzing data, but they also have limitations that should be taken into account when using them. The choice of interval width and contextualization of the data are important considerations when creating and interpreting histograms.
FAQ 216: Updated on: 2 November 2023 17:36
